We had data everywhere and clarity nowhere.
Our marketing funnel touched landing pages, email campaigns, checkout flows, and product experiences — all tracked separately, none of it talking to each other. The questions that should have been easy to answer were effectively unanswerable: Where exactly are users dropping off? Which traffic sources actually convert to revenue — not just to clicks? How long does it take someone to move from free user to paid customer? Which specific behaviors meaningfully predict a purchase?
The underlying problems were structural. Identity fragmentation meant the same user showed up as multiple anonymous profiles depending on where they entered the funnel. Tracking inconsistencies meant events fired differently across systems — or didn't fire at all. Disconnected tools meant GHL, landing pages, email, and checkout were all telling different stories about the same customer journey.
Leadership was making decisions from data they couldn't fully trust — a structural problem with real revenue implications.
I centralized the data layer, then built the revenue funnel on top of it.
I architected and implemented a unified, event-driven analytics infrastructure from the ground up — centralizing everything through Segment, with Mixpanel as the intelligence layer and GHL fully instrumented as a behavioral data source.
The work broke into four components:
-
01Segment — Centralized Event RoutingImplemented Segment as the event routing layer across three sources — JavaScript (app), GHL webhook, and PHP — routing into a single Mixpanel destination. Standardized event naming conventions and property mapping across all touchpoints: UTMs, URL paths, referrer data, campaign attribution. Identity is controlled exclusively inside the app using
analytics.identify(user.id, { email: user.email })— distinct_id maps to user.id with no aliasing and no cohort stitching. GHL events reconnect automatically when users return to the app.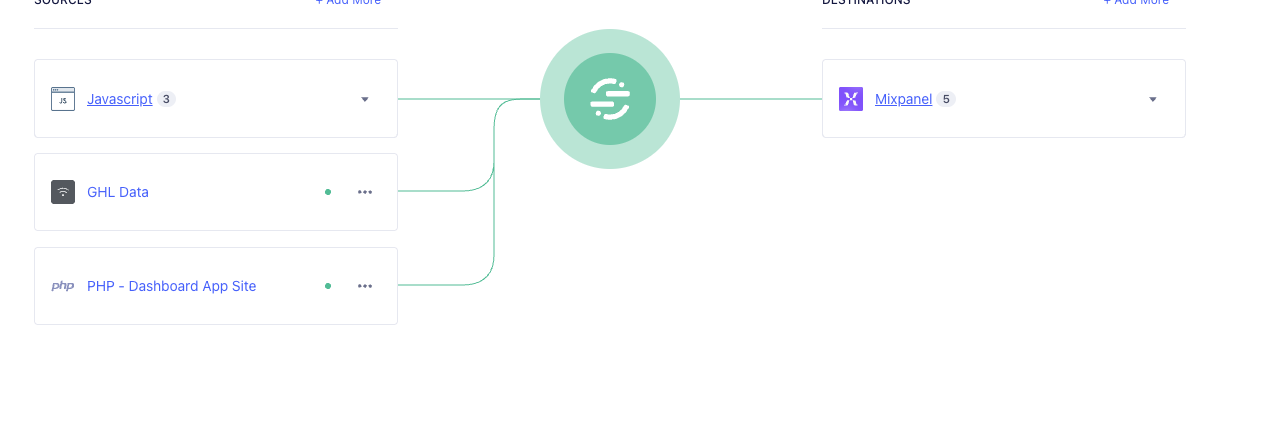
Segment source routing — JavaScript, GHL, and PHP sources unified into a single Mixpanel destination
-
02Mixpanel — 11-Step Revenue FunnelDesigned and built a multi-step funnel tracking the entire customer journey from first page view through checkout completion — eleven distinct steps, each mapped to a specific behavior. The core funnel: Viewed Events LP → WHY Quiz Started → WHY Quiz Completed → Viewed Upsell Page → Checkout Started → Checkout Completed. Extended with intermediate app screens (event_registration, account_setup, discovery_intro, discovery_tips) and two intentionally separate result page steps — the initial result page and the full WHY result page are distinct steps. Added attribution filters by UTM source, campaign, and referrer; step-by-step drop-off analysis using User Conversion Rate across all steps; and a 7-day rolling Trend Over Time card to surface week-over-week shifts.
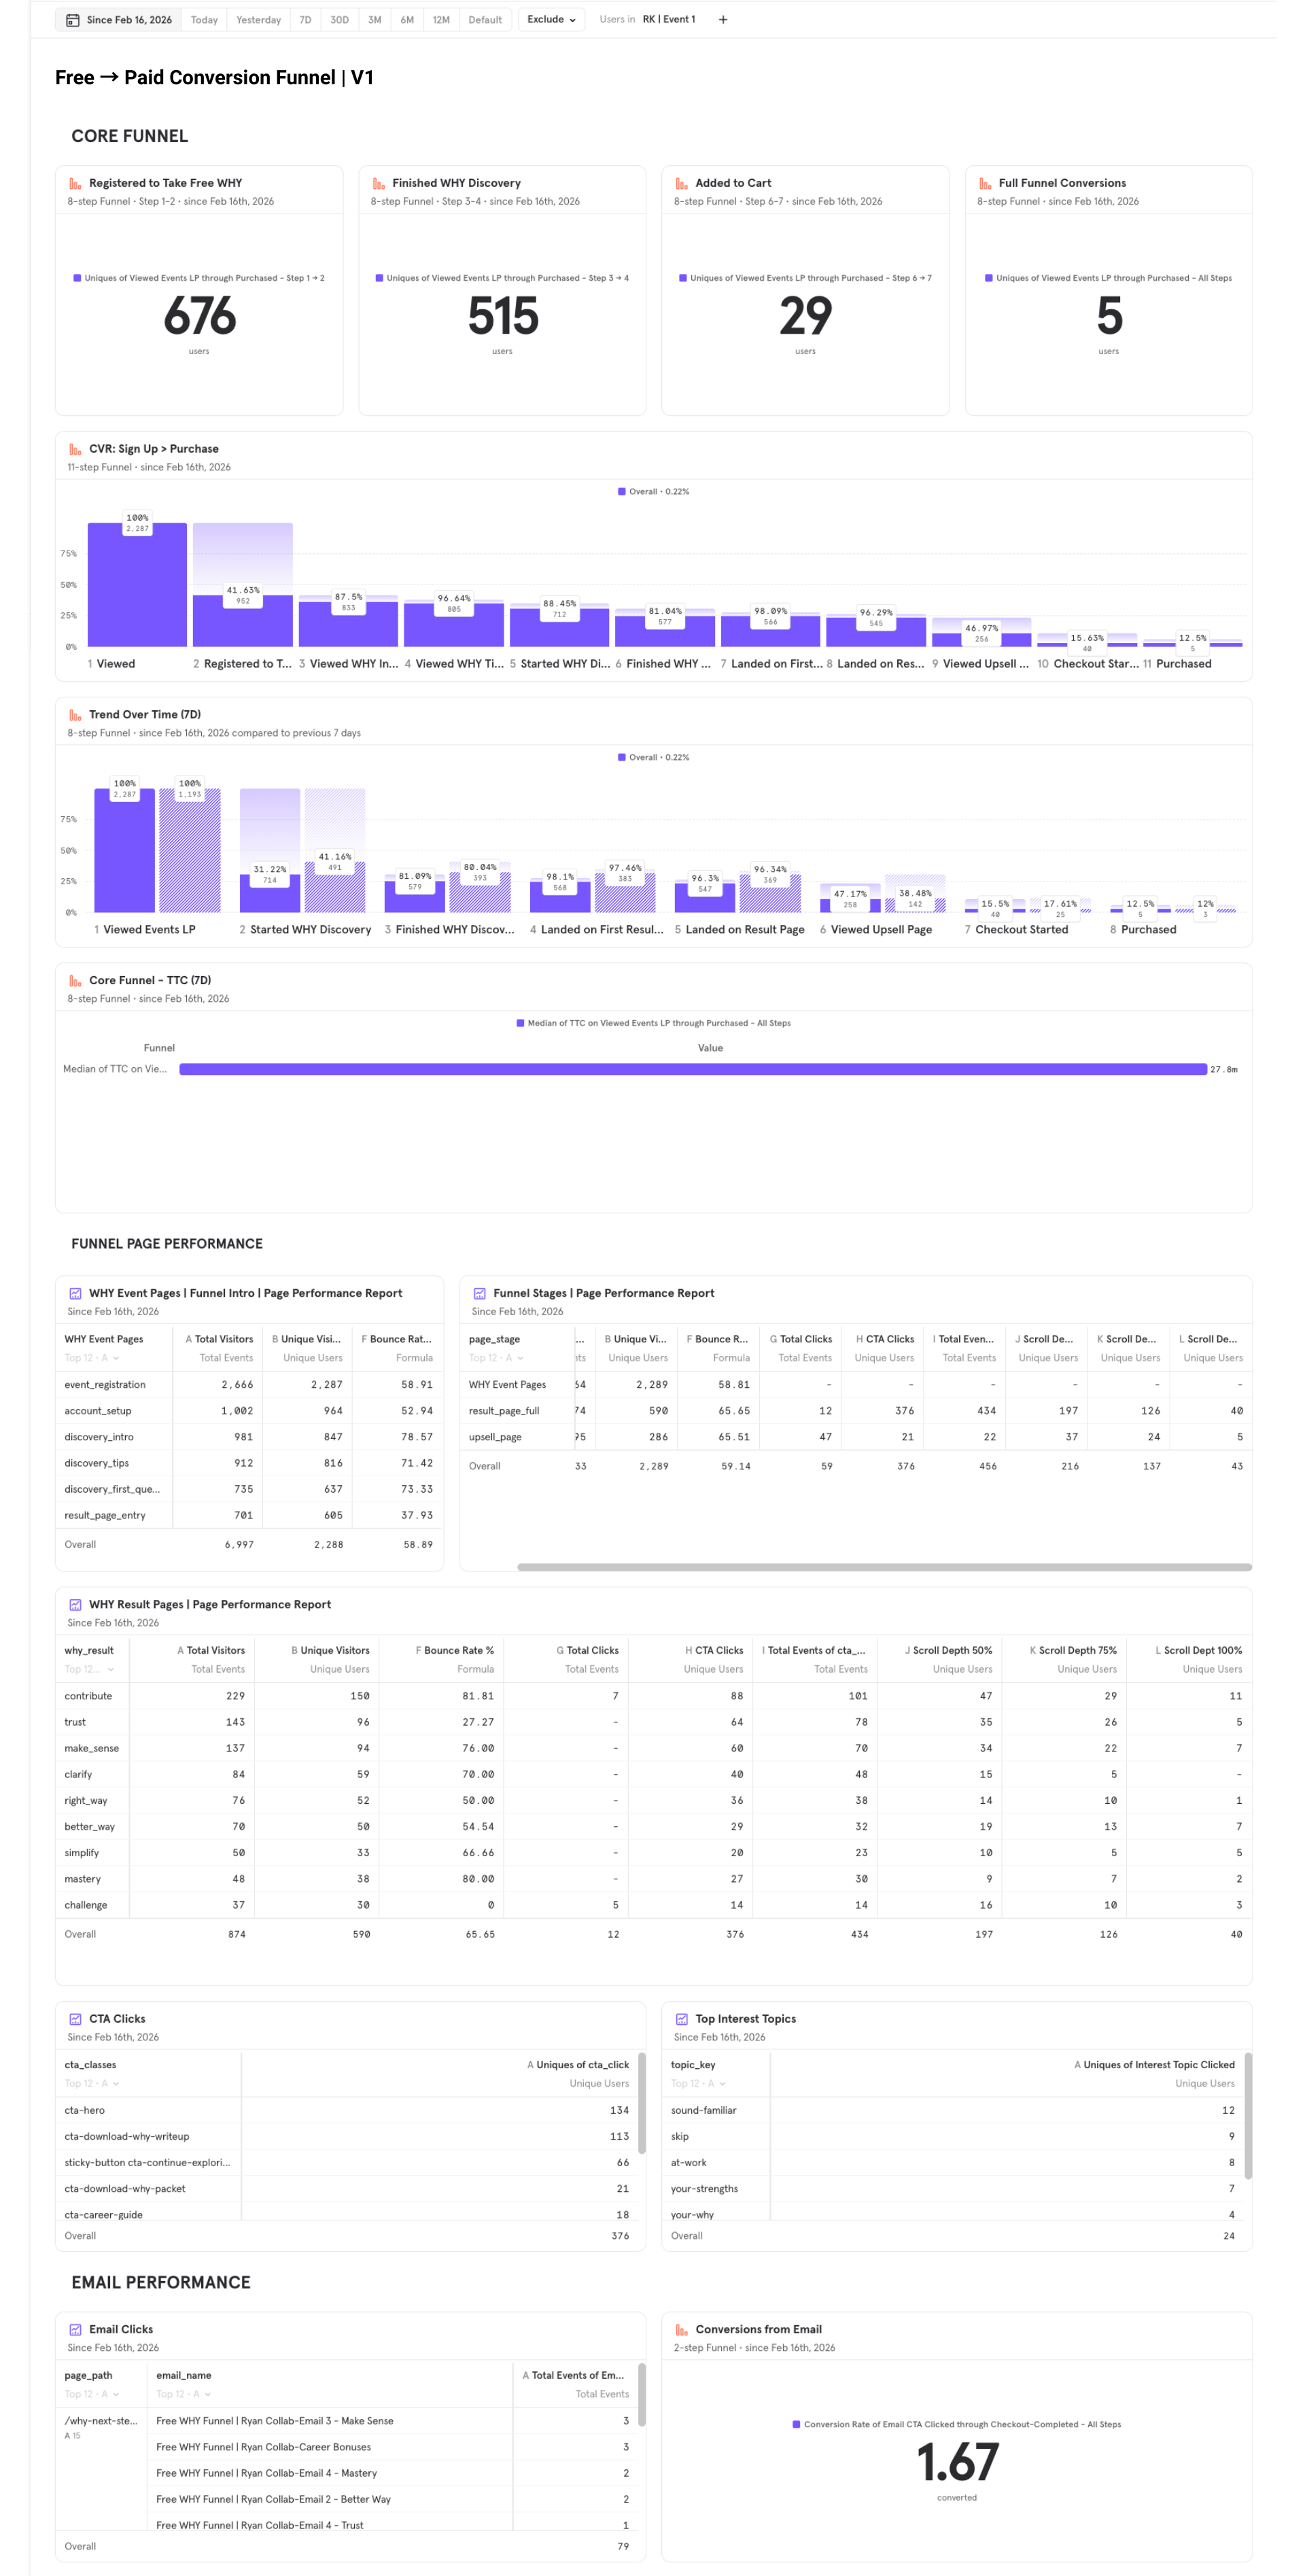
Live Mixpanel funnel board — CVR by stage, trend over time, page performance, and email conversion tracking
-
03GHL — Behavior-Driven AutomationInstrumented structured tracking across all GHL landing pages and forms — ensuring registration events fired reliably, email click-through behavior was captured, and funnel progression aligned with automation triggers. Shifted the automation logic from page-based to behavior-based: responding to what users actually did, not just where they clicked.
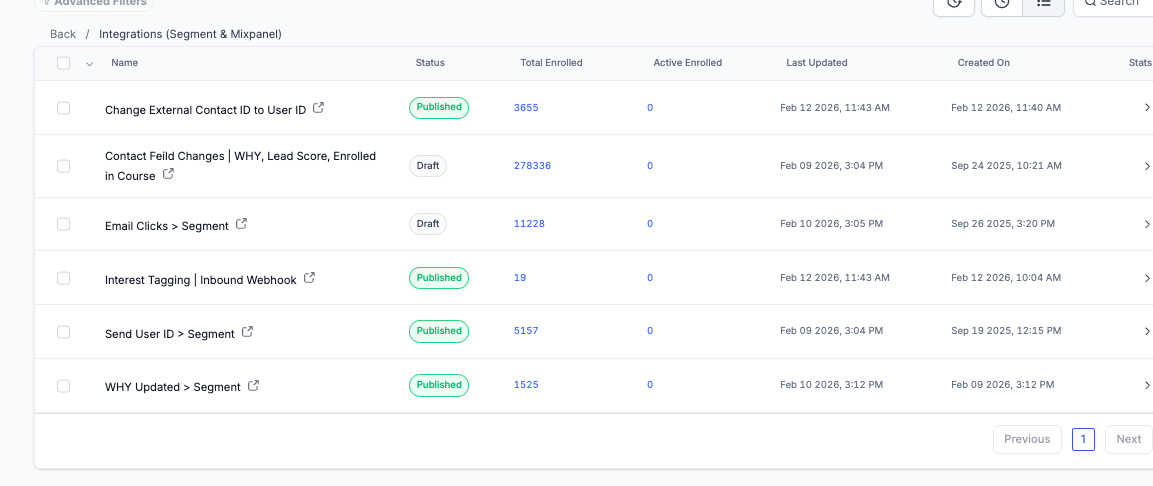
GHL → Segment integration workflows — identity resolution and behavioral data routing
-
04Executive DashboardsBuilt leadership dashboards surfacing core funnel conversion rates by stage, trend over time, median time to convert (using Mixpanel's Time to Convert report — median, not average, over a 7-day window), checkout conversion performance, CTA engagement by element class, and email-driven conversion impact — giving leadership real-time visibility into where revenue was being lost and where optimization would have the highest impact.
The technical work was one layer. The diagnostic work was another.
Building the infrastructure was the visible part. Underneath it was a sustained process of identifying and resolving the things that would have quietly broken everything:
- Anonymous vs. identified user mismatches creating duplicate profiles and inflated funnel counts
- Segment import timestamp discrepancies causing events to appear out of sequence
- Event ordering issues affecting funnel inclusion — contacts being excluded from funnels they had actually completed
- Over-constrained funnel filters producing false drop-offs that made the data look worse than reality
- UTM inconsistencies breaking attribution logic across traffic sources
I built testing frameworks to validate event accuracy at the user level before any of this data was used to make decisions — because a dashboard leadership can actually trust is worth more than one that just looks good.
For the first time, we could see exactly where leads were dropping — and build a plan to do something about it.
Complete end-to-end funnel visibility from first page view to purchase — built from the ground up, on infrastructure that didn't exist when the project started.
- Complete end-to-end funnel visibility from first page view to purchase — for the first time in the company's history
- Precise drop-off analysis by stage, enabling structured funnel optimization instead of guesswork
- Clear attribution by source, campaign, and referrer — leadership could finally see which channels were actually driving revenue
- Behavior-driven automation replacing page-based triggers across GHL workflows
- A scalable analytics infrastructure capable of supporting high-volume joint venture campaigns without breaking
- Executive dashboards delivering real-time clarity into conversion bottlenecks, email effectiveness, and time-to-revenue
Most marketing teams know their funnel is leaking. Very few can tell you exactly where.
This project was about building the infrastructure that turns "we think something's off" into "here's the precise drop-off point, here's the source, and here's what we're doing about it."
A revenue intelligence system earns the name only when the data underneath it can actually be trusted — which means resolving identity fragmentation, standardizing events across every touchpoint, and validating accuracy before anyone makes a decision from the output. That's what this was.
Clean data is invisible. Bad data is invisible too. The only way to tell the difference is to build the infrastructure that makes the distinction clear — and then prove it works before anyone relies on it.